Descriptive vs Inferential Statistics: What Every Australian Student Should Know
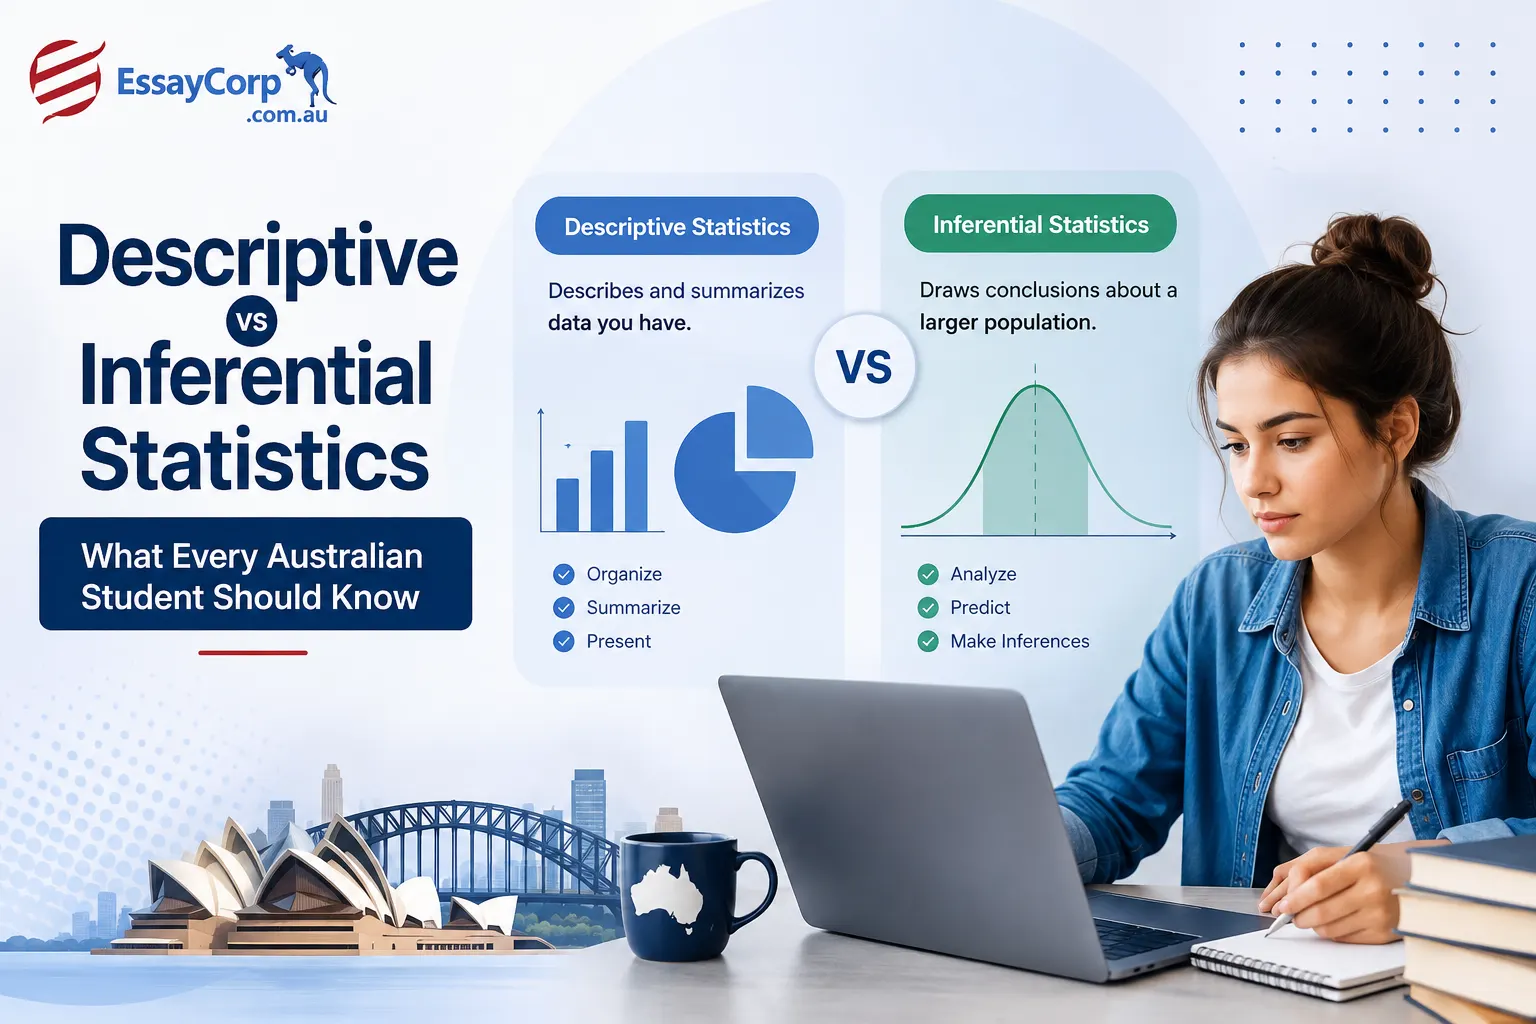
Descriptive statistics summarise and organise the data you actually collected — averages, percentages, charts. Inferential statistics use that sample data to draw conclusions, test hypotheses, or make predictions about a larger population you didn't directly measure. In short: descriptive statistics describe what you have; inferential statistics estimate what you don't.
What Is Descriptive Statistics?
Descriptive statistics is the branch of statistics concerned with summarising, organising, and presenting data clearly — without drawing conclusions beyond the dataset itself. Calculating the average mark of your tutorial group, plotting a bar chart of survey responses, or reporting the range of exam scores in your cohort: all descriptive statistics.
Core Measures Used in Descriptive Statistics
Descriptive statistics typically fall into three categories:
- Measures of central tendency — mean, median, and mode, which identify the "typical" value in a dataset
- Measures of variability (dispersion) — range, variance, and standard deviation, which show how spread out the data is
- Measures of distribution shape — frequency tables, histograms, and percentiles that reveal patterns in the data
A simple example
A class of 30 students sits an exam. The mean score is 72.4%, the median is 74%, and the standard deviation is 11.3. These figures describe exactly what happened in that specific class — nothing more, and nothing less. No claim is made about students outside that group.
What Is Inferential Statistics?
Inferential statistics is the branch of statistics that uses sample data to make estimates, predictions, or generalisations about a larger population, along with a quantified level of uncertainty. Where descriptive statistics stops at "what happened here," inferential statistics asks, "what's likely true more broadly?"
Core Methods Used in Inferential Statistics
- Hypothesis testing — used to determine whether an observed effect is statistically significant
- Confidence intervals — a range of values likely to contain the true population figure
- Regression and correlation analysis — used to examine relationships between variables
- T-tests, ANOVA, and chi-square tests — common tools for comparing groups or testing associations
A simple example
Suppose 200 randomly selected students from a university of 10,000 are surveyed, and 63% support a new grading policy. Using inferential statistics, you might estimate that between 56% and 70% of all 10,000 students support the policy, at a 95% confidence level. That's an inference — a calculated generalisation, not a direct measurement.
Descriptive vs Inferential Statistics: Key Differences
Comparison table
| Aspect | Descriptive statistics | Inferential statistics |
|---|---|---|
| Purpose | Summarise and describe existing data | Draw conclusions about a population from a sample |
| Scope | Limited to the dataset collected | Extends beyond the dataset to a wider group |
| Common tools | Mean, median, mode, range, standard deviation, charts | Hypothesis tests, confidence intervals, regression, ANOVA |
| Certainty | No uncertainty — reports exact facts | Involves probability and a margin of error |
| Typical use | Presenting survey results, exam score summaries | Predicting outcomes, testing whether a difference is real |
| Question answered | "What does this data show?" | "What can we conclude beyond this data?" |
Why This Distinction Matters for Australian Students
Whichever discipline you're studying — nursing, business, psychology, or engineering — assessment tasks increasingly ask you to justify which type of statistical analysis you used and why. Markers at Australian universities are trained to check whether students confuse "describing data" with "generalising from data," because this mix-up is one of the most common analytical errors in undergraduate and postgraduate reports.
Getting this distinction right demonstrates statistical literacy — a skill explicitly valued across health sciences, commerce, and STEM coursework, where evidence-based reasoning underpins almost every assessment rubric.
How They Work Together in Real Research
Descriptive and inferential statistics aren't competing approaches — they're sequential, complementary steps in almost every research project. Most credible studies begin with descriptive statistics to understand the raw dataset, then move to inferential statistics to interpret and generalise the findings.
Typical research workflow
- Collect sample data (e.g. survey responses, experimental results)
- Apply descriptive statistics to summarise the sample (means, charts, frequencies)
- Check assumptions (e.g. normality) before selecting an inferential test
- Apply inferential statistics to test hypotheses or estimate population parameters
- Report findings with appropriate confidence levels or p-values
Common Mistakes Students Make
- Treating descriptive statistics (like a sample mean) as if it applies to the entire population without running an inferential test
- Choosing the wrong inferential test for the data type (e.g. a t-test when the data isn't normally distributed)
- Reporting a p-value without explaining what it actually means in context
- Ignoring sample size and confidence intervals when interpreting results
- Copying statistical interpretations from textbooks instead of explaining findings in their own words — a common academic integrity issue Australian markers actively check for
What Australian Universities Expect in 2026
Australian institutions continue to place strong emphasis on academic integrity and correct, properly cited statistical reasoning. Universities Australia's academic integrity framework and individual university policies require that statistical claims, formulas, and interpretations sourced from textbooks or software documentation be properly referenced, whether you're using APA, Harvard, or another style specified by your faculty.
In 2026, many Australian universities also require students to disclose any use of AI tools in the statistical analysis process, in line with generative AI academic integrity guidelines now standard across most institutions. If you use AI to check a calculation or explain a concept, you're generally expected to acknowledge it, following your university's specific declaration requirements.
Referencing Statistical Sources Correctly
Whether you're citing the Australian Bureau of Statistics, a textbook formula, or a journal article that used a particular test, correct referencing (APA, Harvard, or your discipline's required style) is non-negotiable for maintaining academic integrity in quantitative assignments.
How to Improve Your Statistical Analysis Skills
Checklist for statistics assignments
- ✓Identify whether the task requires descriptive analysis, inferential analysis, or both
- ✓Report descriptive statistics before attempting any inferential test
- ✓Check test assumptions (normality, sample size, independence) before selecting a method
- ✓Interpret p-values and confidence intervals in plain language, not just numbers
- ✓Reference all formulas, tools, and data sources correctly
- ✓Proofread your data interpretation against your original dataset for accuracy
Practising with real datasets — from lecture-provided data or platforms like Perdisco — is one of the most effective ways to build confidence with both descriptive and inferential methods before assessment deadlines.
If you're working through a statistics unit and want structured support, our Statistics Assignment Help service is built specifically around Australian coursework requirements, covering everything from descriptive summaries to hypothesis testing and regression analysis.
If you're also working on quantitative coursework in finance, you may find our guide on "Best Assignment Help Services in Australia: What Students Should Know in 2026" helpful for understanding how to choose reliable academic support while maintaining originality and academic integrity.Key Takeaways
- ✓Descriptive statistics summarises the data you have; inferential statistics generalises beyond it
- ✓Descriptive methods include mean, median, mode, range, and standard deviation
- ✓Inferential methods include hypothesis testing, confidence intervals, and regression
- ✓Good research always starts with descriptive analysis before moving to inferential analysis
- ✓Australian universities expect correct referencing and transparent use of AI tools in statistical work
Conclusion
Descriptive and inferential statistics aren't rival concepts — they're two connected stages of sound data analysis that every Australian student encounters at some point in their degree. Once you can confidently tell the difference and know when to apply each, statistics assignments become far less intimidating and far more logical. Focus on describing your data accurately first, then use the right inferential tools to draw honest, well-supported conclusions.
Frequently Asked Questions
Q. What is the main difference between descriptive and inferential statistics?
Descriptive statistics summarises the exact data collected, while inferential statistics uses that sample to make estimates or predictions about a larger population.
Q. Which comes first: descriptive or inferential statistics?
Descriptive statistics always comes first. Researchers summarise and understand their dataset before applying inferential methods to generalise findings.
Q. Can a student use both types of statistics in one assignment?
Yes. Most Australian assignments require both — descriptive statistics to summarise data, then inferential statistics to test hypotheses or draw broader conclusions.
Q. Why do Australian universities care about referencing in statistics assignments?
Correct referencing shows academic integrity, credits original sources of formulas or data, and meets Australian institutions' strict plagiarism and citation standards.
Q. What tools help students with descriptive and inferential statistics?
Software like SPSS, Excel, and R are common, alongside structured guidance from lecturers, tutorials, or professional statistics assignment help services.